CTD Instruments
CTD (Conductivity, Temperature, and Depth) instruments measure three important parameters directly - conductivity, temperature and pressure. By measuring conductivity (how easily electric currents pass through the water sample being tested), scientists can get a measurement of that water sample's salinity. This is because electric current passes much more easily through water with a higher salt content. So if we know the conductivity of the water, we know how much salt is in the water. Salinity is measured in psu (practical salinity units). Accuracy of the measurement is generally better than 0.005 psu for a standard CTD profiler.
A CTD instrument usually uses a thermistor, a platinum thermometer, or a combination of these to measure the temperature of the water. Temperature as measured by a CTD instrument has an accuracy of greater than 0.005 degrees Celsius.
Finally, a CTD instrument measures pressure using either a strain gauge pressure monitor or a quartz crystal-based digital pressure gauge. Pressure is recorded in decibars, and since depth and pressure are directly related, a measurement in decibars can be converted to depth in meters. Conveniently, the pressure in "X" decibars is almost exactly equal to the pressure found at "X" meters of depth. For instance, at about 500 meters below the surface, the pressure is right around 500 dbars. The CTD instrument can measure pressure to within an error margin of about 1%.
Density of water is calculated from in situ measurements of conductivity (salinity), temperature and pressure. An equation called the equation of state of water relates the measurements so that density can be found if these other three values are known.
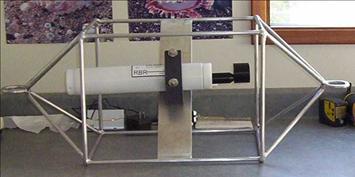
RBR Profiling CTD
Ocean Ecology's CTD is an XR-620 from RBR Ltd.
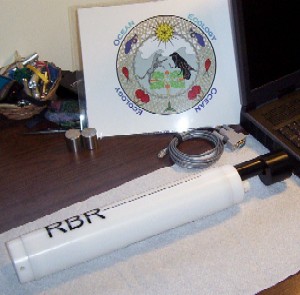
This unit is a small profiling logger with a 6 Hz sampling rate, and the capacity to support up to six sensors, including conductivity, temperature, depth, pH/ORP, dissolved oxygen, fluorescence, turbidity, transmittance, and PAR. The model which we use measures conductivity, temperature, and depth. All calibration constants are stored in the logger, and recalibration is possible by the end-user under suitable conditions. Conductivity, temperature, and depth are measured using RBR sensors calibrated to NIST traceable standards.
Technical Description
Depth
- Range: 250 m
- Accuracy: ±0.05% full scale
- Resolution: <0.001% full scale
- Time Constant: < 10 msec
Temperature
- Range: -5 °C to 35 °C
- Accuracy: ± 0.002 °C
- Resolution: <0.00005 °C
- Time Constant: 0.095 sec
- Drift: <0.002 °C/year
Conductivity
- Range: 250 m
- Accuracy: ±0.03 to ±0.003 mS/cm
- Resolution: up to 0.0001 mS/cm
- Time Constant: < 95 msec
The data from the XR-620 can be downloaded to a computer, and software is provided that visualizes this data.

Ocean Data View
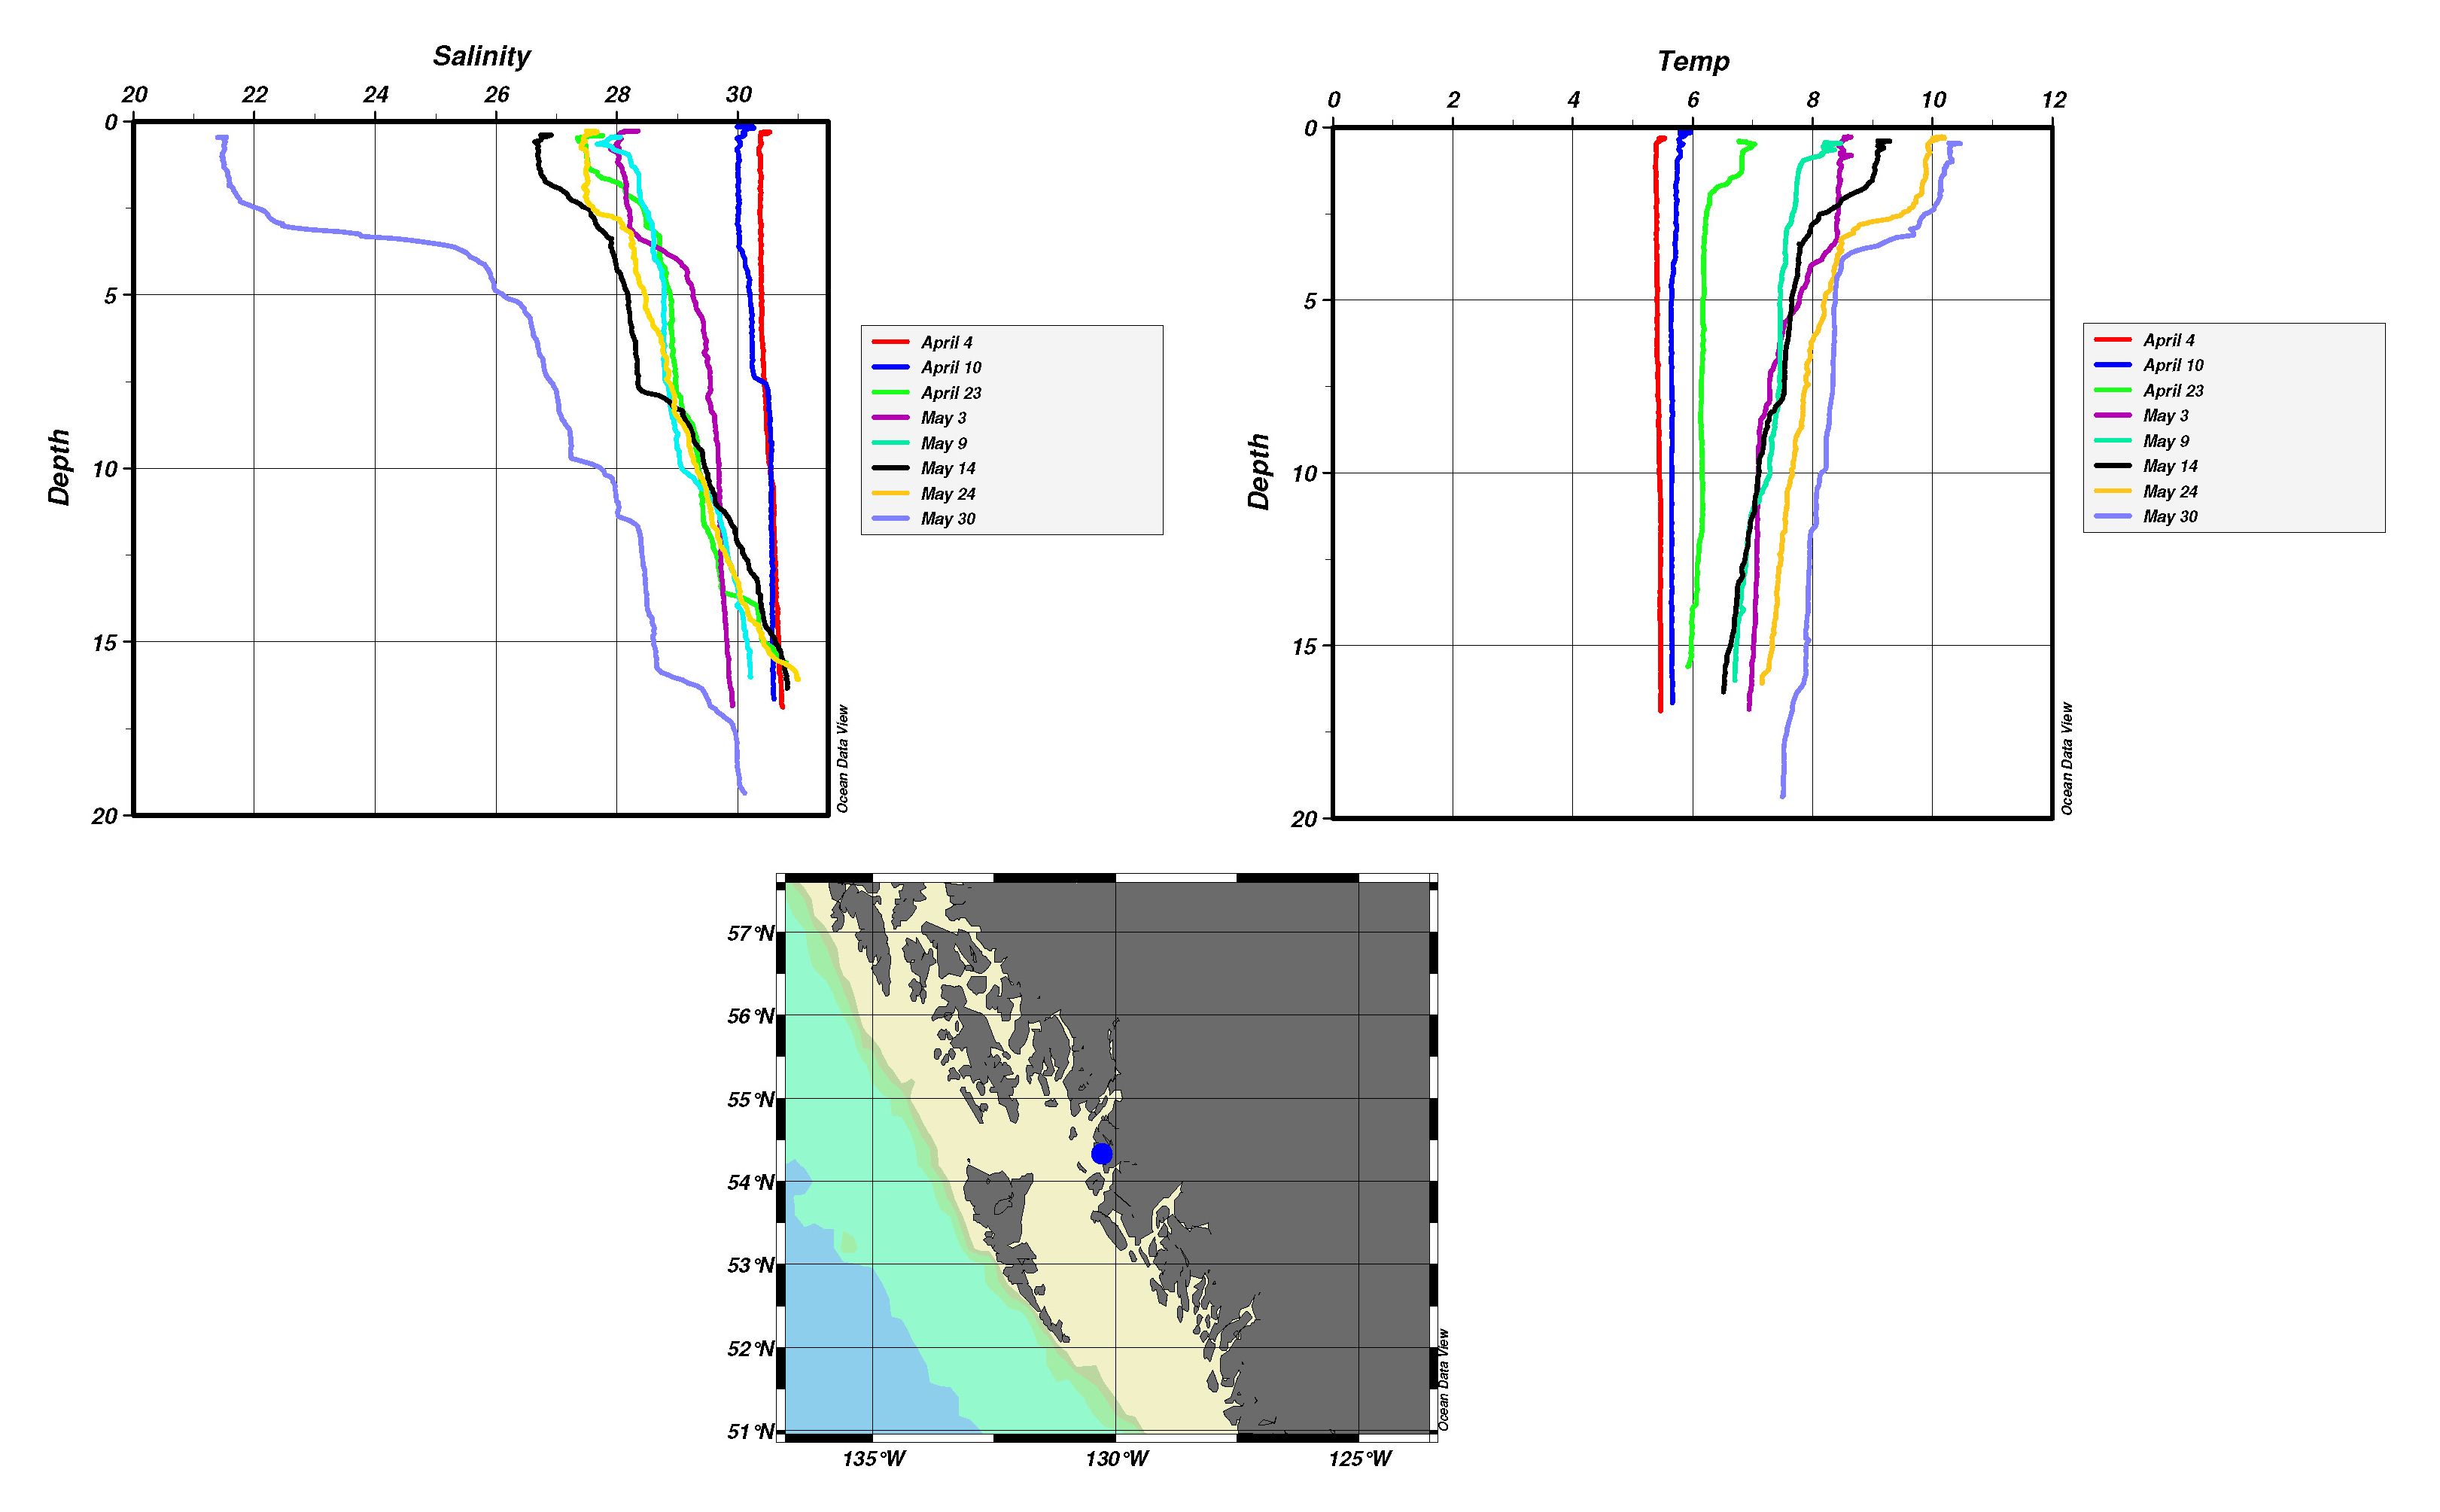
Further processing of the data can be done using software such as Ocean Data View. This allows trends in the data over time to be visualized. The data can be plotted as a series of profiles over a period of time to show how salinity and termperature properties in a water body change with time.
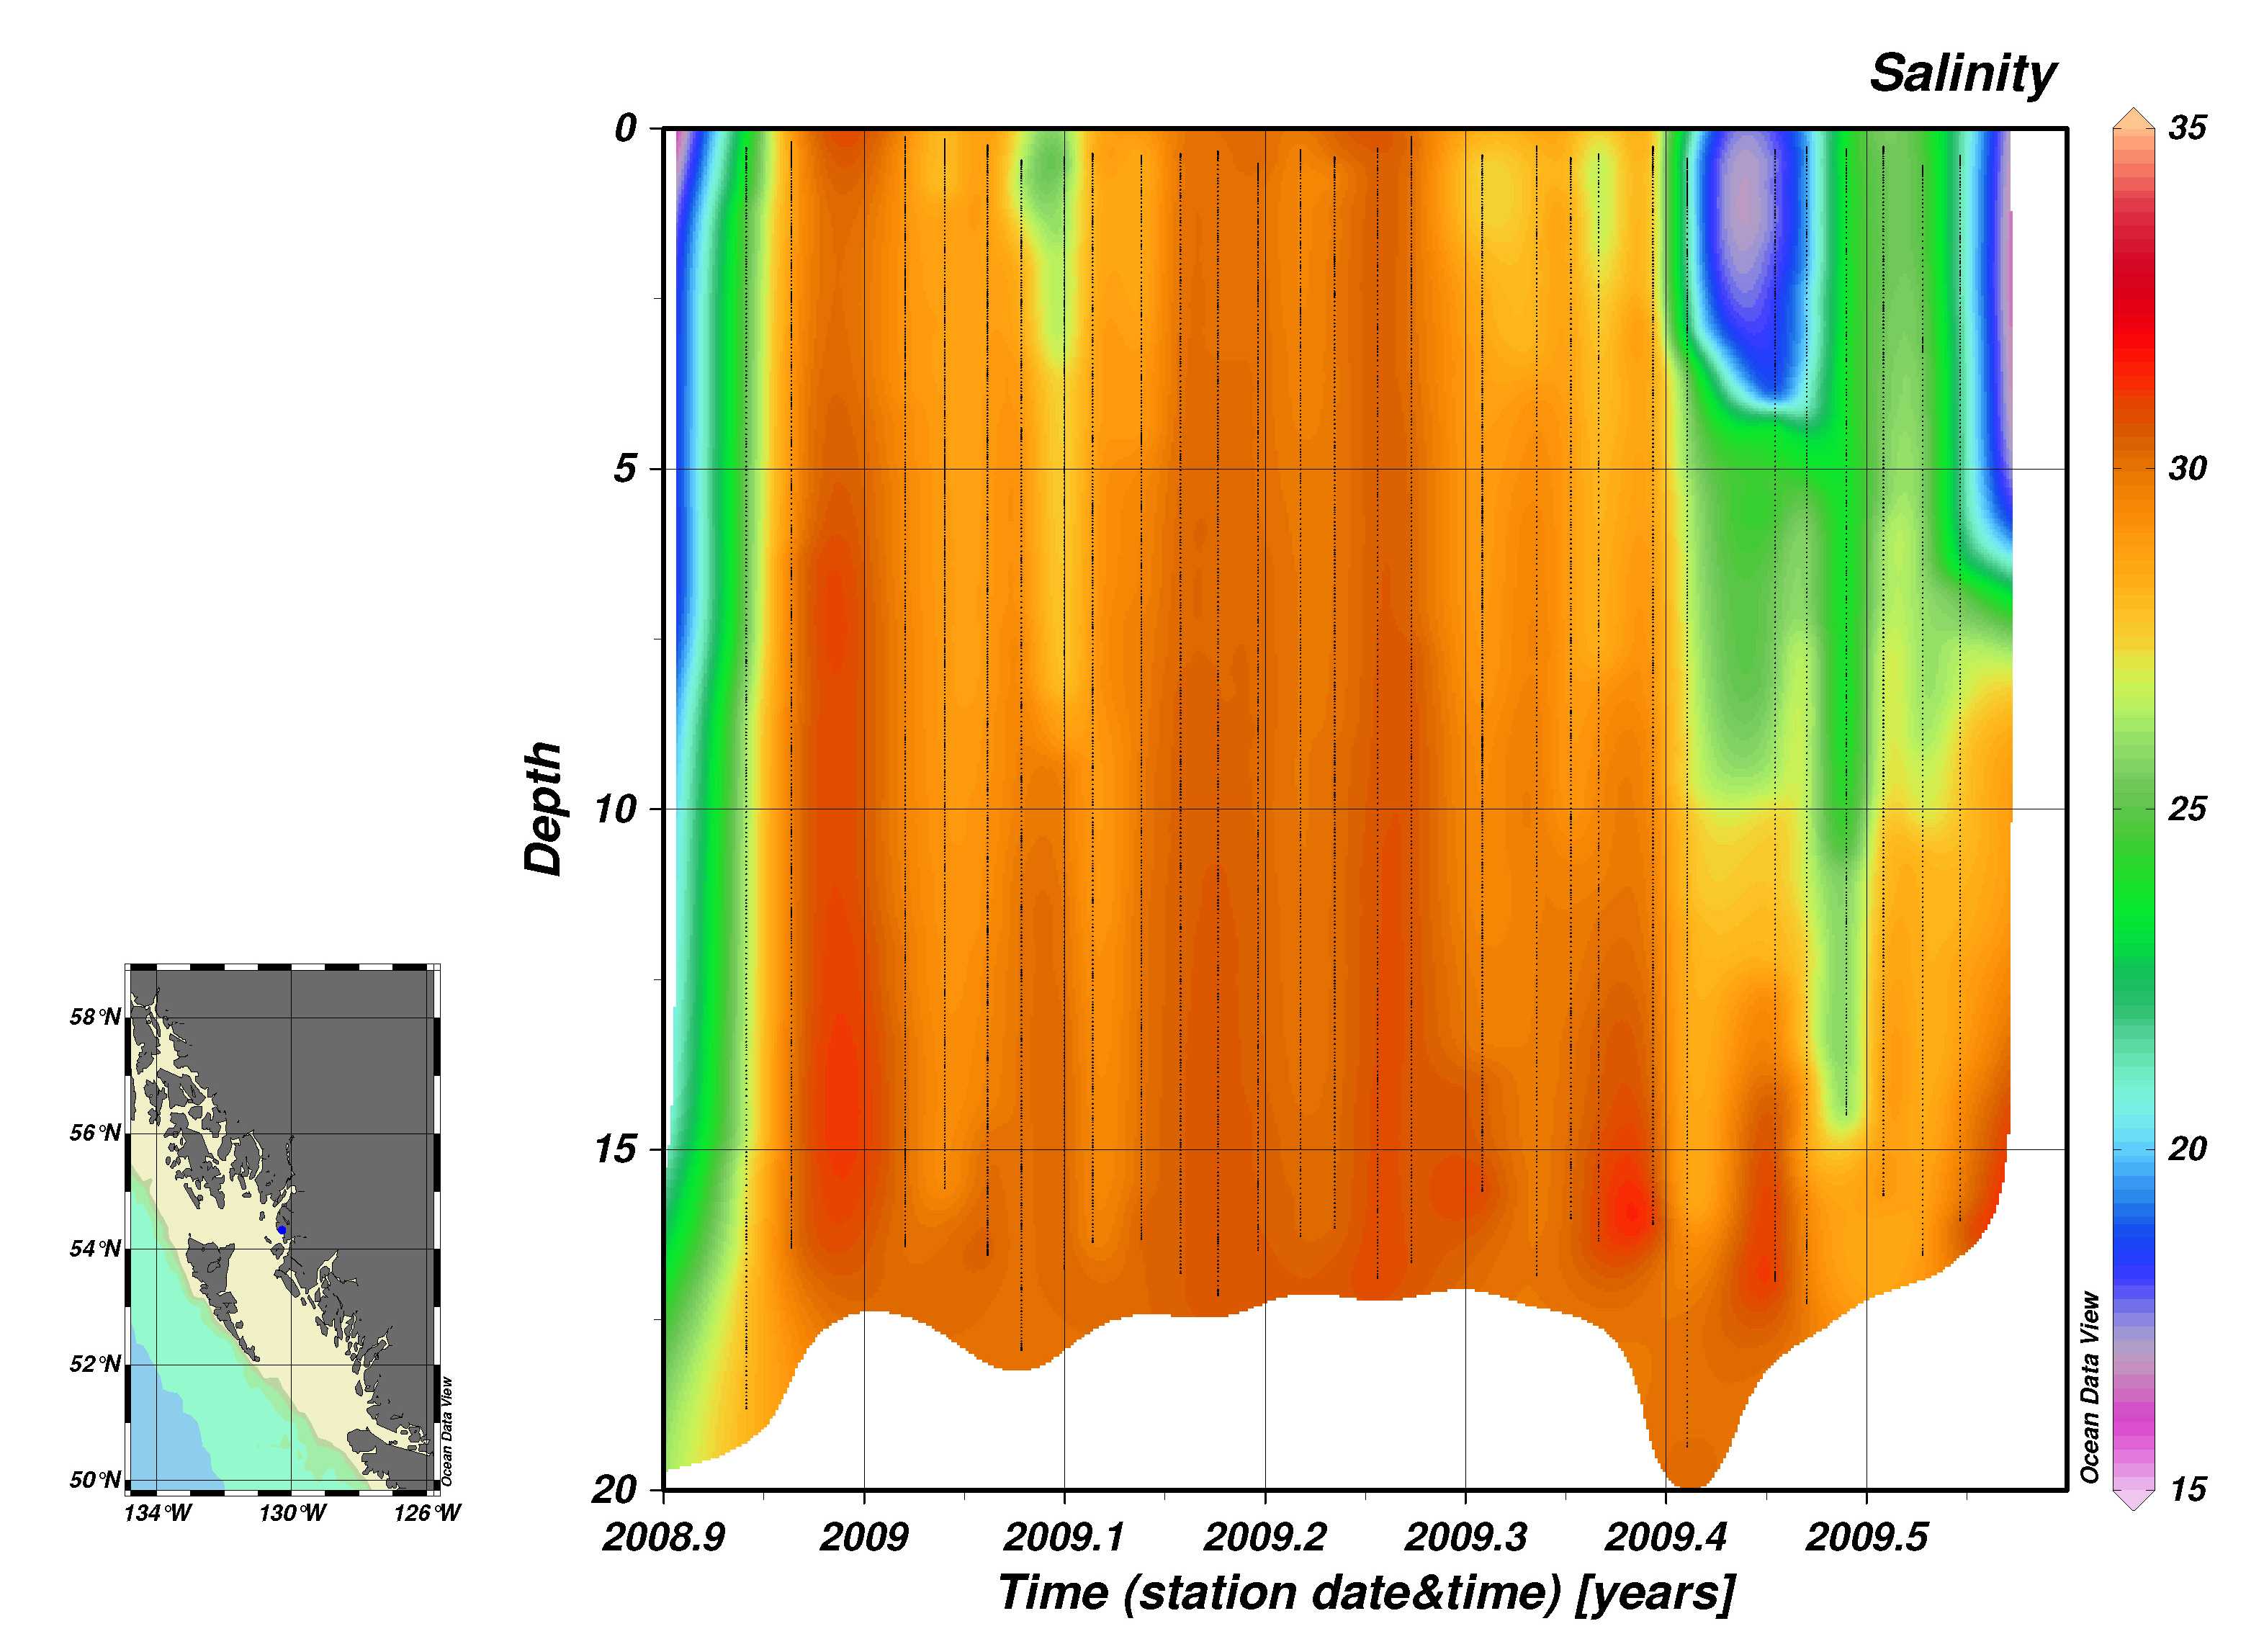
Alternatively, a more complex contour plot can be generated showing changes in salinity or temperature with time.